League Points Table
| # |
TEAM |
MAT |
WON |
LOST |
N/R |
TIE |
PTS |
WIN % |
NET RR |
FOR |
AGAINST |
| 1 |
 Zabarwan
 |
4 |
4 |
0 |
0 |
0 |
16
|
100.00% |
4.9076 |
557/44.4 |
363/48.0 |
| Loading ...
|
| 2 |
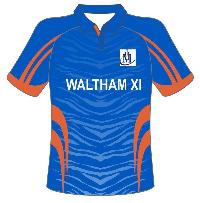
 Waltham XI
 |
3 |
2 |
1 |
0 |
0 |
8
|
66.67% |
3.0556 |
343/36.0 |
233/36.0 |
| Loading ...
|
| 3 |
 Boston Giants
 |
3 |
2 |
1 |
0 |
0 |
8
|
66.67% |
2.0136 |
177/18.5 |
176/23.5 |
| Loading ...
|
| 4 |
 Woburn Tigers
 |
2 |
2 |
0 |
0 |
0 |
8
|
100.00% |
1.6603 |
151/19.3 |
146/24.0 |
| Loading ...
|
| 5 |
 Nashua Warriors
 |
2 |
2 |
0 |
0 |
0 |
8
|
100.00% |
0.9167 |
77/12.0 |
66/12.0 |
| Loading ...
|
| 6 |
 Rising Stars
 |
3 |
2 |
1 |
0 |
0 |
8
|
66.67% |
0.0763 |
221/34.1 |
212/33.1 |
| Loading ...
|
| 7 |
 Galaxy XI
 |
3 |
2 |
1 |
0 |
0 |
8
|
66.67% |
-0.1863 |
170/23.5 |
172/23.3 |
| Loading ...
|
| 8 |
 Boston All Stars
 |
4 |
2 |
2 |
0 |
0 |
8
|
50.00% |
-0.6101 |
391/45.1 |
434/46.5 |
| Loading ...
|
| 9 |
 Boston Blazers
 |
1 |
1 |
0 |
0 |
0 |
4
|
100.00% |
6.5000 |
129/12.0 |
51/12.0 |
| Loading ...
|
| 10 |
 Kings
Kings |
2 |
1 |
1 |
0 |
0 |
4
|
50.00% |
1.3920 |
99/17.1 |
105/24.0 |
| Loading ...
|
| 11 |
 Panthers
 |
2 |
1 |
1 |
0 |
0 |
4
|
50.00% |
1.3355 |
175/19.0 |
189/24.0 |
| Loading ...
|
| 12 |
 NE Blazers
 |
2 |
1 |
1 |
0 |
0 |
4
|
50.00% |
-1.5417 |
222/24.0 |
259/24.0 |
| Loading ...
|
| 13 |
 Boston Challengers
 |
3 |
0 |
3 |
0 |
0 |
0
|
0.00% |
-3.0731 |
282/36.0 |
369/33.5 |
| Loading ...
|
| 14 |
 Methuen Warriors
 |
3 |
0 |
3 |
0 |
0 |
0
|
0.00% |
-5.7039 |
199/36.0 |
307/27.2 |
| Loading ...
|
| 15 |
 Billerica XI
 |
3 |
0 |
3 |
0 |
0 |
0
|
0.00% |
-6.8333 |
69/36.0 |
70/8.0 |
| Loading ...
|
| 16 |
 Eagles Xi
 |
4 |
0 |
4 |
0 |
0 |
0
|
0.00% |
-8.2266 |
222/48.0 |
332/25.5 |
| Loading ...
|
 Zabarwan
 Waltham XI
 Boston Giants
 Woburn Tigers
 Nashua Warriors
 Rising Stars
 Galaxy XI
 Boston All Stars
 Boston Blazers
 Kings
Kings Panthers
 NE Blazers
 Boston Challengers
 Methuen Warriors
 Billerica XI
 Eagles Xi